A STRONG FOUNDATION FOR GROWTH
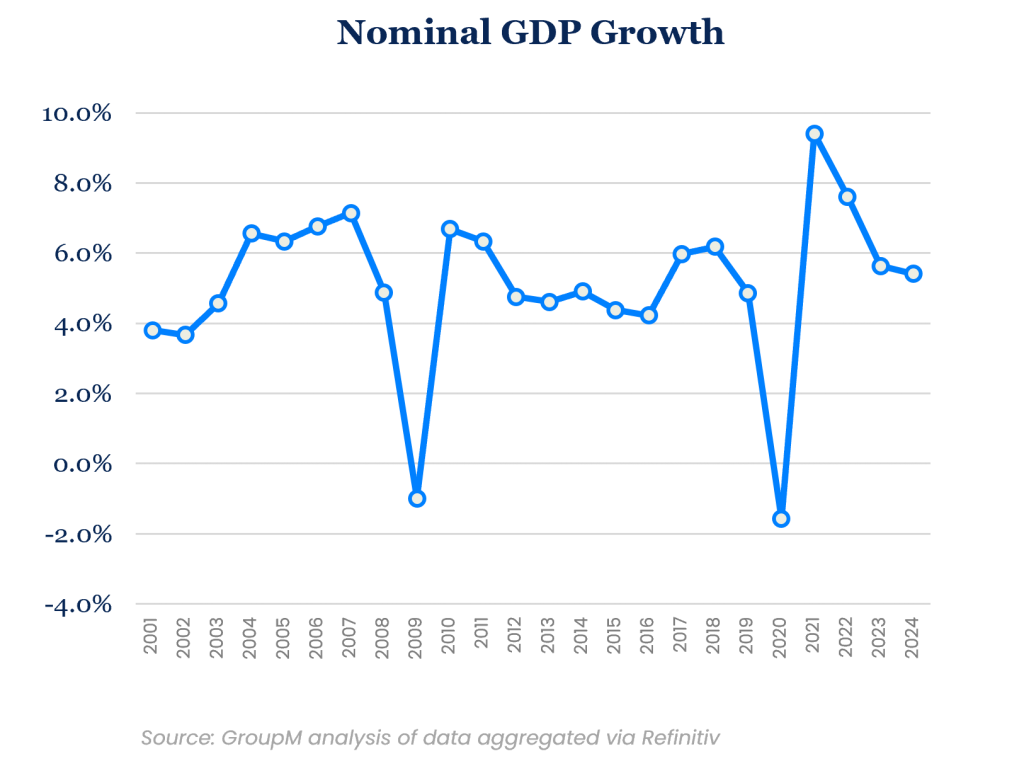
Most assessments of the advertising industry’s performance begin with a view of the broader economy, usually relying on Gross Domestic Product (GDP) as a proxy for its overall health. This approach is rooted in strong historical correlations between the growth rate of advertising and overall economic activity in many markets. Then, in 2020, when the advertising industry performed decently during one of the worst economies on record—even faring better at a global level than it did in 2001 and avoiding the declines of 2009—those connections appeared somewhat tenuous. Whatever the quantifiable relationship, a growing economy should be supportive of growth in advertising spending and, on that basis alone, we can say that the current economic environment is very favorable for the industry—far stronger than any experienced so far this century.
More specifically, global GDP forecasts produced by the IMF in October and analyzed in nominal terms (that is, not adjusted for inflation to mirror how we will look at the advertising industry’s growth), using updated exchange rates from November as aggregated by Refinitiv, shows an expected constant currency nominal growth rate of 9.4% for the markets we track in This Year, Next Year. This follows a 1.6% decline recorded last year and precedes a forecast of 7.6% growth during 2022.
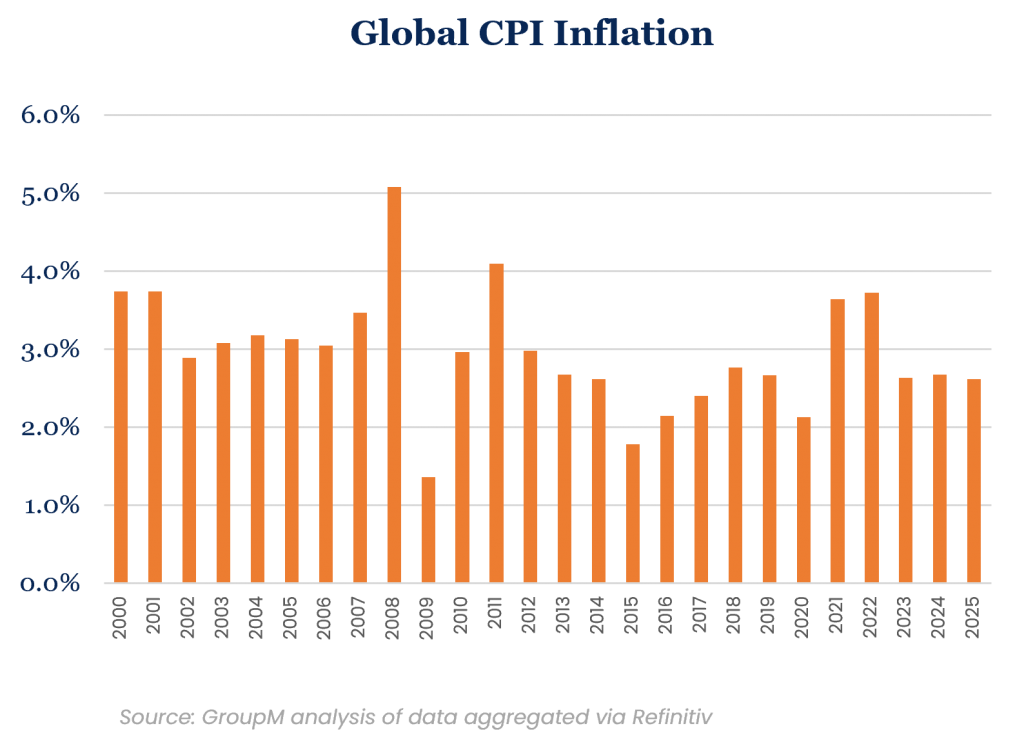
Conditions are a little less rosy if we consider economic activity in real terms, adjusting for inflation: Current global levels of inflation are expected to reach nearly 4% during 2021 and 2022, a relatively high figure. However, even adjusting for higher prices, real GDP should still be considered historically strong.
While inflation can offer an advantage for some market participants—especially those able to pass along higher costs to customers—it can also create economic friction. For example, a manufacturer that can’t pass along higher costs for a particular product may decide to simply stop making it. There are certainly instances of that occurring now, as when a restaurant closes because of a lack of labor (or alternatively, when that restaurant is unwilling to pay higher wages), but, in general, consumers are demonstrating a willingness to pay more for what they want.
At the same time, supply chain constraints mean that some manufacturers are unable to secure all the goods they want to sell. However, this is often occurring because other companies have secured access to critical inputs instead. Those companies that are lacking key components could choose to make fewer of the same products they made before the pandemic. Instead, we often see them reserving scarce components for higher-value goods or eliminating features from lower-value ones in order to make the most of existing production lines. As long as they are making anything, most manufacturers end up spending money on advertising to support their evolving business goals,
at least so long as they believe that doing so is more effective than not. “Going dark,” as it were, is not an ideal alternative when competitors are maintaining or expanding their advertising budgets and growing their share of voice in the process. In an economy that is undeniably strong, spending more on advertising has tended to be the more favorable choice for established manufacturers and newer ones alike.
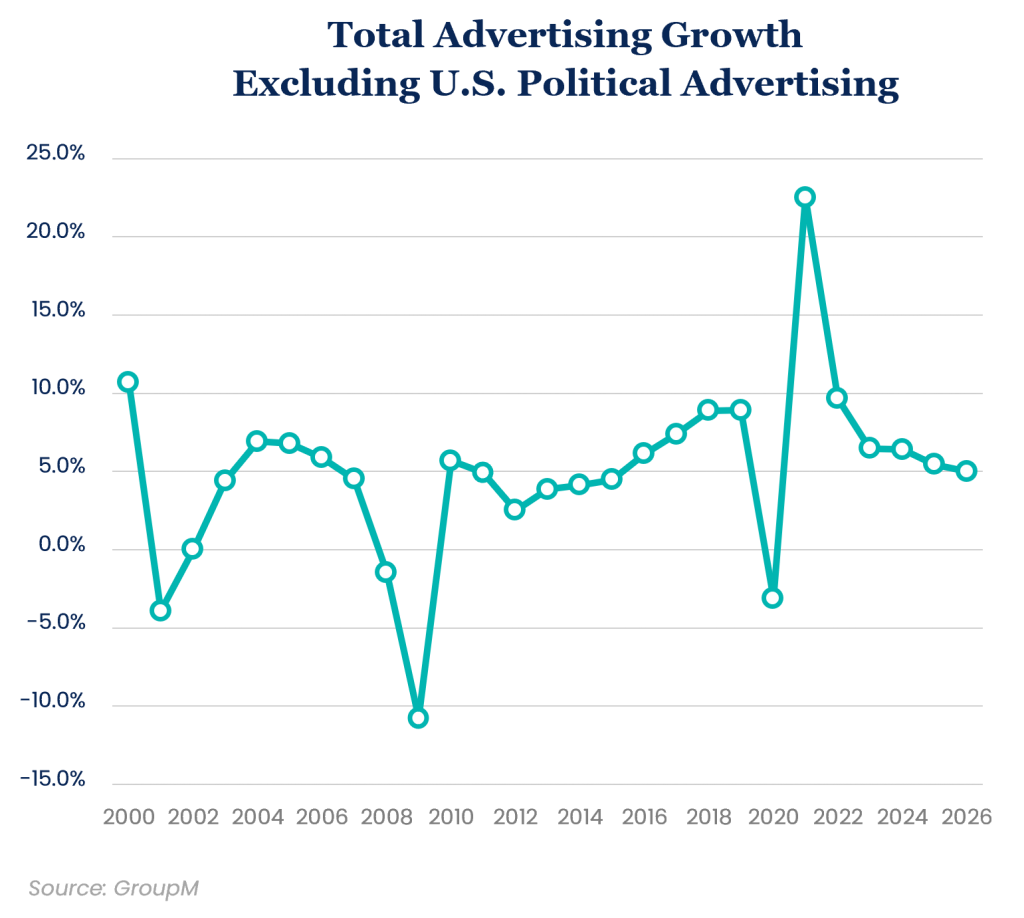
Within this context, the advertising industry is expanding much faster than we anticipated earlier in the year. Our industry-wide expectation for global advertising in 2021 now calls for a growth rate of 22.5% versus 19.2% previously (both figures exclude U.S. political advertising). Likewise, 2022 is poised to grow faster than we predicted in June: We now forecast global growth of 9.7% versus 8.8% previously. At a global level, the media we track here—TV, digital platforms, audio, newspapers and magazines, cinema and outdoor media—will collectively account for $766 billion in ad revenue. Combined, they should exceed $1 trillion in revenue during 2025 based upon our new estimates.
We recognize the rates of growth observed in 2021 appear to be historical anomalies in an industry more accustomed to mid-single digit levels. However, a heightened pace of expansion for the advertising industry could very well persist as long as economies around the world are producing companies that are more reliant on advertising than those they replace.
We would further emphasize that growth rates may vary widely by country. While many of the underlying trends we observe are global, they do appear to be isproportionately concentrated in the U.S., the U.K. and China, which together account for approximately 70% of all the industry’s growth, despite making up about 60% of the total market. Still, our expectations for expansion are relatively widespread: Among the 64 territories we track, we expect the median one to expand by 19.4% in 2021 and 9.1% in 2022. In most instances, growth appears especially strong when viewed in comparison to declines in 2020, although two-year growth rates between 2019 and 2021 are also commonly well above historical averages.
Looking at the top 10 advertising markets over longer time horizons, growth should moderate, with France, Germany, Australia and the U.S. all poised to grow in a range of 4-5% annually, on average, over the next five years, while markets including India, the U.K., Brazil, Canada, Japan and China are forecast to grow between 6-8% annually, on average.
Of course, there also are risks to the durability of all of this growth. We’ve previously noted that at least some of the expansion occurring in advertising may be due to several specific kinds of businesses. These include i) new small businesses, many of which emerged or expanded rapidly during the pandemic, and which may have allocated greater shares of resources to nationally oriented digital advertising than the businesses they effectively replaced in the economy, ii) marketers based in China that capitalize on low-cost international shipping and that specifically use global digital platforms to reach overseas consumers and iii) app developers or other “digital endemic” businesses that are rooted in the internet economy, many of which focused on advertising-driven top-line revenue growth regardless of the near-term profitability of that activity but were aided by “hot” capital markets that have been happy to reward customer acquisitions at almost any cost.
Any of the factors causing the emergence of these businesses could go into reverse as suddenly as they started to accelerate. For practical purposes in establishing our forecasts, we don’t expect a new round of hyper-growth from any particular large set of marketers. At the same time, we don’t think that the companies that drove 2021’s growth will go away anytime soon. Together, these considerations lead to moderating, if still historically strong, growth expectations for the advertising economy in 2022.
MEDIA ACCELERATES IN 2021, KEEPS A FAST PACE IN 2022
DIGITAL ADVERTISING DRIVES RESULTS
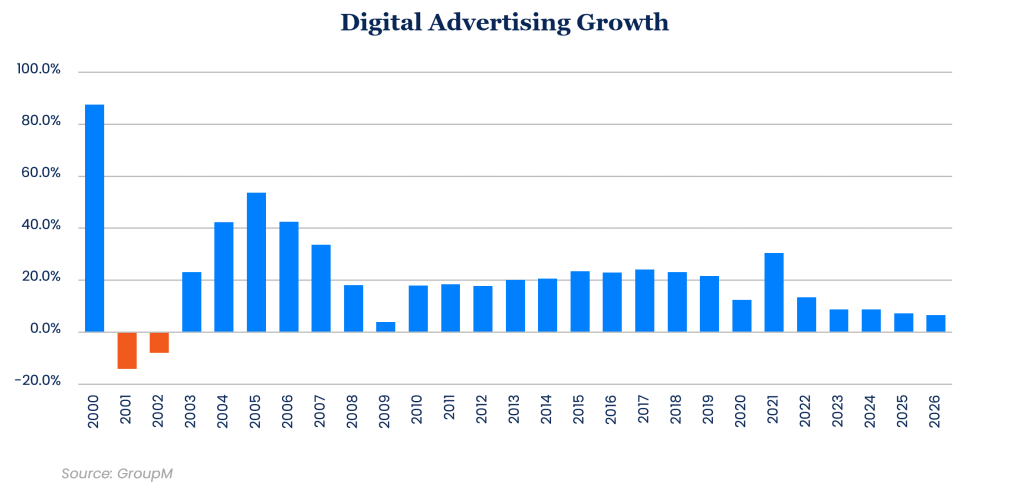
Digital advertising will likely end 2021 growing by 30.5%, excluding U.S. political advertising, which is remarkable considering the base line established in 2020. The sub-sector will account for $491 billion in its narrow definition (i.e., excluding revenues from digital extensions of traditional media) or $537 billion in its broader form. The narrow form of digital advertising should grow by an additional 13.5% during 2022.
On this basis, digital advertising should account for 64.4% of total advertising in 2021, up from 60.5% in 2020 and 52.1% in 2019. Excluding China, where digital advertising shares are particularly high, global digital advertising accounts for 58.7% of all advertising in 2021. Within these figures, the world’s largest sellers of advertising outside of China—Alphabet, Meta and Amazon—account for somewhere between 80-90% of the global total, by our estimates. Looking at total advertising outside of China in all its forms, the three aforementioned media companies represent more than 50% of the industry’s total in 2021, up from closer to 40% in 2019.
One might argue that such levels of concentration are important for individual content creators and small advertisers, but less so for the larger advertisers we focus on. Best practices dictate that large marketers always maintain the capacity to walk away from any given media outlet, given the range of alternatives they have to reach audiences and allocate resources.
Digital advertising rose to account for 64.4% of total advertising in 2021.
Because many marketers seek to benchmark their budgets against industry-wide averages, it’s important to note some spending dynamics that may be lost in the overall numbers. For example, smaller companies and businesses that operate entirely online likely allocate 100% of their budgets to digital media, while marketers that have an omnichannel orientation, or are large enough to activate other media, tend to have lower shares of spending on digital media. The result is that, in reality, the typical large brand spends substantially less than the average amount, as we explore later on in this document. Importantly, the more broadly we define digital advertising, the more that all advertising is considered to be digital. As time progresses, the distinction between digital and non-digital advertising will become less meaningful than the distinction between the media companies, whose products will increasingly blur lines that historically divided different media types.
From all of this analysis, one could be forgiven for thinking that the changes Apple made to the availability of iOS user data don’t matter. Such an observation would generally be correct, at least at an industry level. While some feared these changes would lead to reductions in ad spending, our view has always been that marketers look for the “least-bad” available data at any given time, recognizing that no data is ever perfect. With that constraint, they continually adjust spending and budget allocations to satisfy goals as best as they can. Apple’s iOS changes certainly benefitted its own advertising business, but it’s harder to know with any precision whether Alphabet, Meta and Amazon might have grown faster or slower had changes not occurred. Each of them still grew at historically fast rates in 2021, and not much differently in the third quarter (post changes) than in the first (pre-changes). Overall, it seems unlikely that the impact on industry-level spending was anything more than marginal, much as the roll-out of GDPR in Europe was barely perceptible, despite the radical change that law initially represented.
TELEVISION TO RETURN TO 2019 LEVELS IN 2023, RETAINS IMPORTANCE FOR LARGE BRANDS
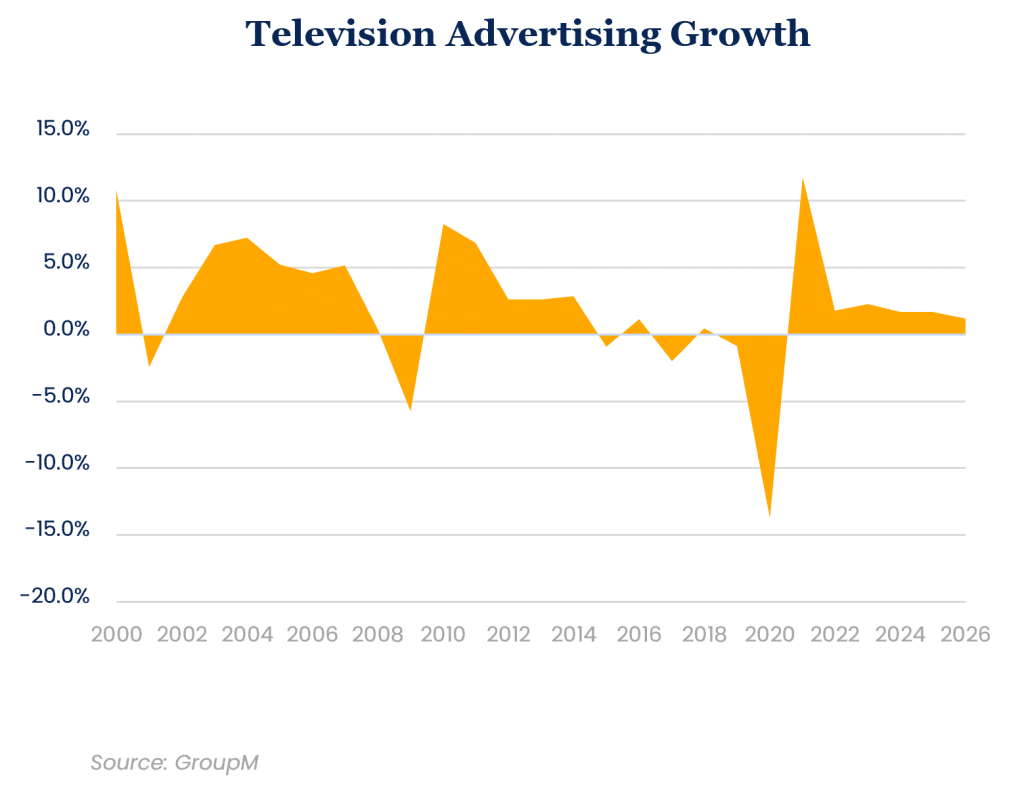
At an industry level, television is clearly the next-most important medium after digital. In its broadly defined form (but excluding political advertising in the United States, which otherwise skews year-over-year growth rates globally), we forecast that global television advertising will grow by 11.7% in 2021. Given the depths of 2020’s decline, which amounted to a loss of 13.7%, the industry is not expected to return to 2019 levels until 2023, excluding U.S. political advertising.
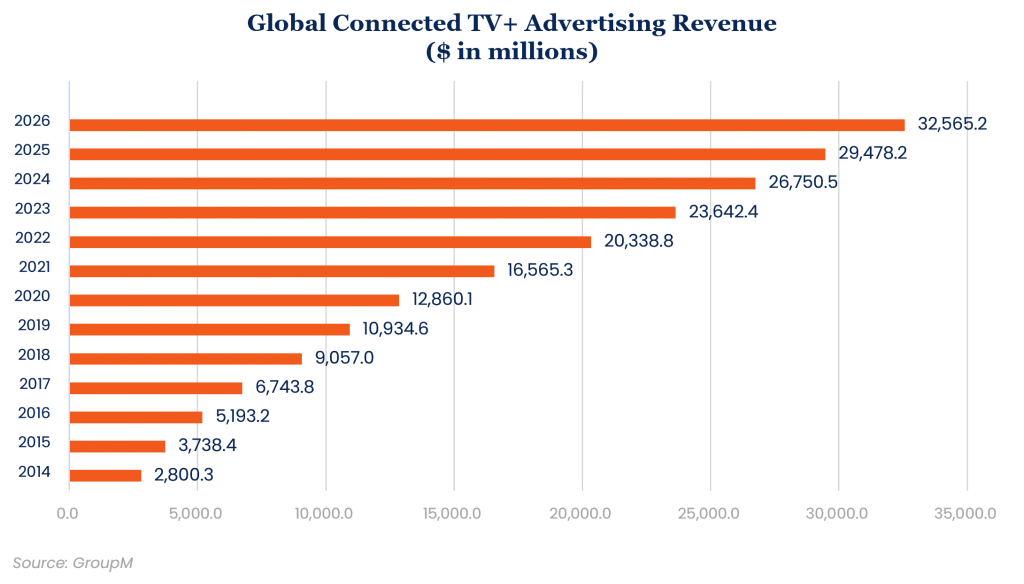
Subsequent years will be generally flat for television in most major markets around the world, as the largest advertisers that historically dominate the medium continue to incrementally shift their spending elsewhere. These shifts are offset in part by growing television budgets from the larger upstarts whose businesses are primarily online. Overall, total TV advertising should amount to $171 billion in 2022 and, of that figure, approximately $17 billion will go to Connected TV+. Covering the digital extensions of professionally produced television content, Connected TV+ remains poised to grow substantially, with our forecast for 2026 now up to $33 billion.
Most marketers are keen to capitalize on the rise of Connected TV+ advertising, both because of the heightened reliance on data and because of the growing availability of programmatic inventory. However, even this type of media will mostly be used to build brands the way traditional marketers used traditional TV for many decades: by combining sight, sound and motion-based messaging together while borrowing on the brand equity of the programs around which their advertisements run.
Importantly, the primary reason for all of the growth we expect in Connected TV+ advertising is that these environments are simply where a large and growing share of viewing is shifting. We recognize that much of this space is, and will remain, ad-free, largely because the dominant players, such as Netflix, Amazon Prime and Disney+, are ad-free and plan to remain so in most of the world for the foreseeable future. While there are other service providers that intent to sell ads, they are investing less than these three in original programming, which will likely result in lower viewing shares. Consequently, the emerging world of television will simply offer fewer opportunities to advertise.
As a practical consideration, falling viewership of ad-supported TV in traditional environments will lead to reduced reach potential for campaigns that rely on the medium, which will generally make TV less attractive to many marketers. To deal with this challenge, some will look to better integrate the management of campaigns on YouTube and traditional TV rather than manage them separately, as typically occurs today. To the extent that YouTube and traditional TV converge, this will help sustain the role of a broadly defined notion of television in the media mixes for many, while further blurring the lines between TV, digital and search advertising for others.
OTHER MEDIA HAS MIXED OUTLOOK BUT DIGITAL INTEGRATION WILL SUPPORT FUTURE GROWTH
Such blurriness is not new to the print industry, where magazines and newspapers—at least those that have survived the sector’s upheavals—have shifted aggressively to invest in digital capabilities. Increasingly, titles that might once have been launched as magazines or national newspapers are digital-only. For our purposes, this raises murky questions about what, exactly, constitutes a magazine or newspaper. In time, our own definitions will evolve to better match the new reality.
Several recent deals illustrate the need for new definitions. Meredith, one of the world’s largest traditional magazine publishers (which only a few years ago bought its once-larger peer Time Inc.), announced in the fall that its business, which generated $2.1 billion in total revenue in the year ending June 30, would be sold to the digitally focused Dotdash (formerly About.com), a unit of IAC that generated only $264 million in revenue over the same period.
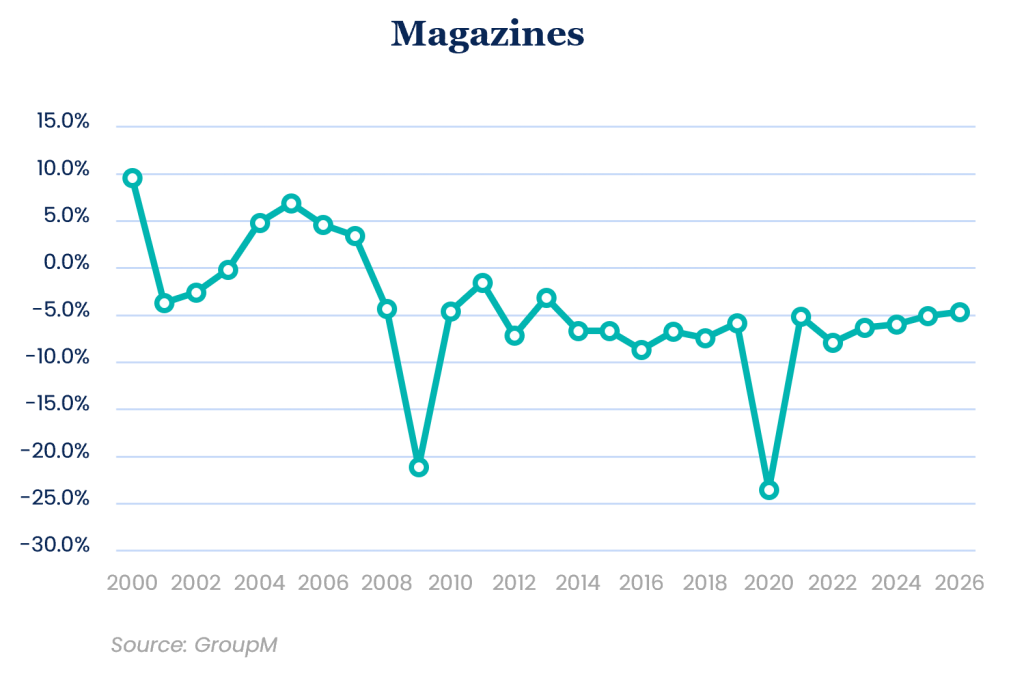
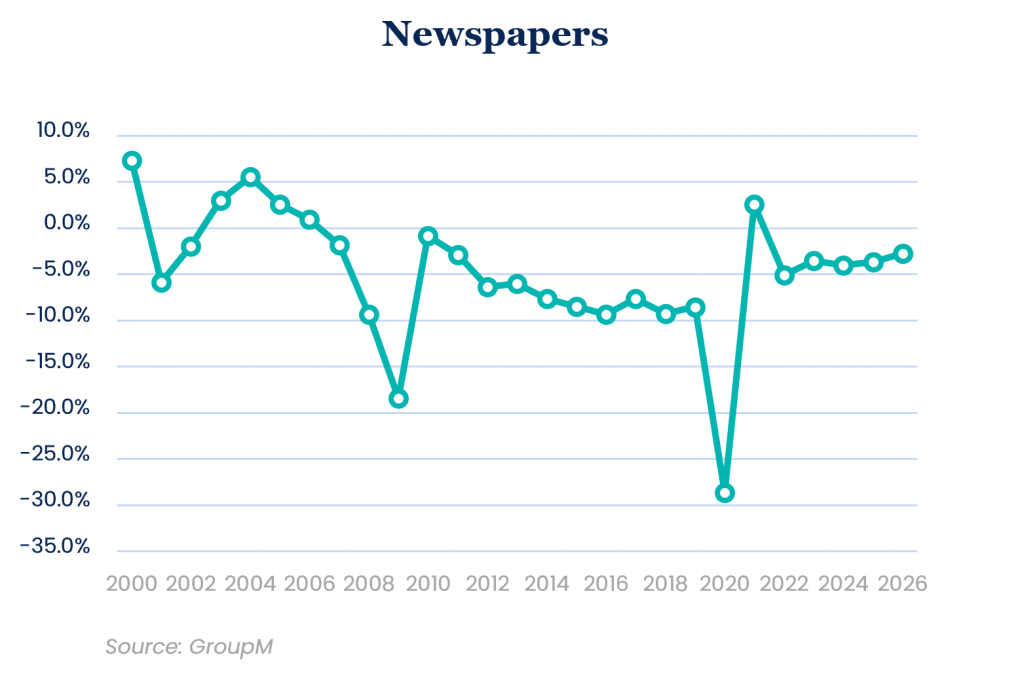
In some ways, this transaction reflected a reversion to a strategy that was briefly popular in the first decade of this century: In 2000, niche publisher Primedia bought About, which it then sold to The New York Times Co. in 2007. Historically, many early efforts by publishers to build up their digital platforms led them to effectively trade their “analog dollars” for “digital pennies.” As the business contracted and matured, not every property has ultimately survived, but those publishers that did are more likely to find new and better ways to sustain their overall operations and grow them in the years ahead. It remains to be seen if a combination of intent-based digital media and brand-focused traditional print will prove to be synergistic in this instance, but ongoing efforts of this nature will probably allow a broadly defined print industry—including digital-only equivalents—to return to growth over time. Our forecasts anticipate roughly flat trends during 2021 (with newspapers up slightly and magazines down slightly), although this “expansion” is really only because 2020’s declines were so profound. Beyond 2021, we expect continual low- to mid-single digit declines for the business, including its digital extensions.
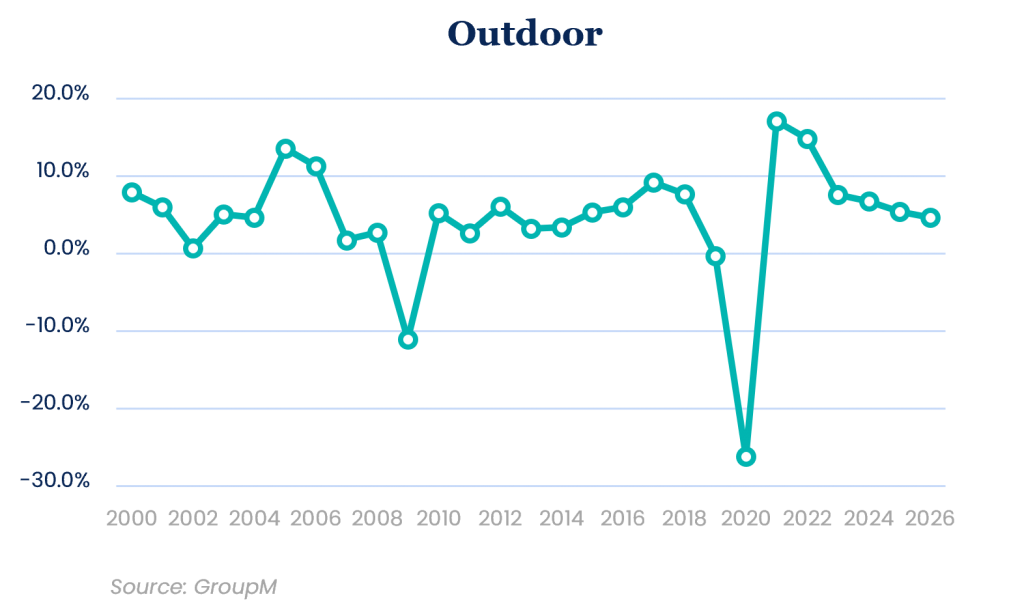
In many markets, audio and outdoor advertising have experienced similar trends, perhaps because of their generally local market-specific orientation and perceptions that each is primarily consumed away from home. Overall, both mediums posted mid-20 percentage point declines at a global level last year before beginning a gradual, if incomplete, recovery that we think will be punctuated by elevated growth in 2022. Around the world, we expect audio to grow 15.6% in 2021 and 6.4% in 2022, while we expect outdoor to grow 17.1% in 2021 and 14.9% in 2022.
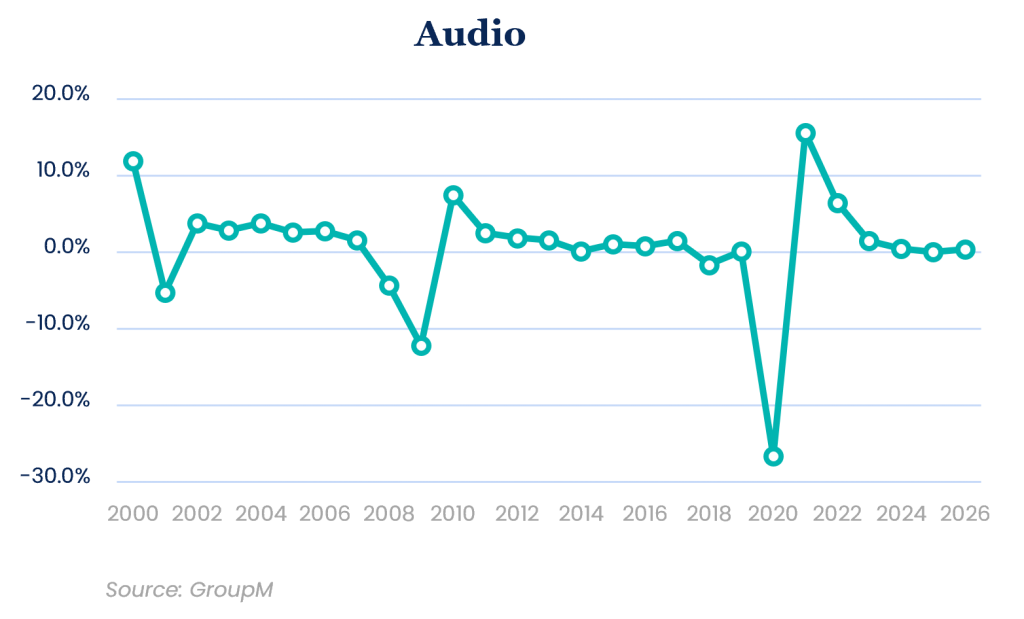
In subsequent years, we essentially assume a reversion to historical trends, which include a largely flat audio business and mid-single digit growth for outdoor. In both instances, we are including digital extensions in these figures. In the audio category, digital streaming services and podcasting-related revenues have become increasingly important parts of media plans and are critical to helping the industry avoid decline given its relatively unfavorable mix of smaller, locally constrained advertisers. Meanwhile, in outdoor, the growing availability of digital screens is helping expand the capacity of the industry, while greater numbers of marketers, such as those in the technology and luxury markets, look to capitalize on outdoor’s unique capacity to reach individuals in the world’s largest cities.
U.S., CHINA AND U.K. REMAIN WORLD’S MOST IMPORTANT GROWTH MARKETS
For several years now, three markets have stood out for their contributions to global growth, significantly outperforming the rest of the world despite their already massive size. We believe the U.S., the U.K. and China have all spurred substantial numbers of small businesses to increase their use of massive digital platforms. They have also been home to large numbers of suddenly big and rapidly growing venture-funded or early-stage publicly listed businesses. Many have driven their results through “growth hacking” techniques that relied heavily on Google, Meta and Amazon. The rapid growth of the Chinese economy helped the other two markets in other ways, too: Low-cost international postal rates paired with narrow targeting of consumers on digital platforms and the ease with which physical and virtual goods could be developed quickly helped build the Chinese presence in the U.S. and U.K., among other places. We can see this trend in data from Marketplace Pulse that shows Chinese manufacturers now represent 41% of Amazon Marketplace vendors in the U.S. and 36% in the U.K. Presumably, this activity is contributing to at least some of Amazon’s growth in ad revenue, too. Meta’s financial disclosures list China first among the individual countries from which it generates revenues, despite having no consumer-facing presence in the market.
United States
The U.S. is poised to grow in a similar manner, with total growth for 2021 in the low 20s (22.7% to be precise, up from our prior forecast of 17.3%), also led by digital advertising. However, excluding the effects of political advertising, we expect underlying growth of 28.4%, which is probably one of the fastest rates of expansion on record. Leading the way are pure-play digital platforms, which we expect to grow by around 39%, substantially higher than our June forecast when we predicted that digital would “only” grow by 29%. As a result of this rapid expansion, digital advertising should account for 60% of total advertising tracked in our data, up from 54% in 2020 and 47% in 2019. In our current forecasts, which include double digit growth in 2022 and single-digit rates of expansion beyond that, the U.S. is trending toward 71% of industry-wide revenue coming from digital advertising by 2026.
Beyond the previously mentioned issues with supply chains, inflation, the changing availability of data in digital advertising and the continuing expansion of Alphabet, Meta and Amazon, one issue that is unique to the U.S. is the degree to which U.S.-based TV networks are looking to expand globally following heavy initial investments in the U.S., which is effectively serving as a large-scale pilot market.
Investments in streaming services are occurring at a significant scale in the United States, and profoundly impacting TV consumption.
As a consequence, investments in streaming services within the U.S. are occurring at a significant scale and profoundly impacting trends around the consumption of TV. As this U.S.-led phenomenon is set to become even more global than it already is, it should produce a warning sign, of sorts, for marketers around the world. Already we can see that total internet-connected device-based consumption accounts for 24% of total TV consumption, up from 19% at this same time last year. Meanwhile, pay TV subscriptions continue to fall, limiting the reach potential of ad-supported TV by a greater degree than what we are seeing in most other markets.
Nonetheless, television will hold its own weight in absolute terms, as the defections of some advertisers will be offset by the emergence of others, while ongoing growth in political advertising—set to account for around $7 billion in ad revenue in 2022—helps sustain the overall sector’s durability on a multi-year basis. In fact, we expect that by 2026, political advertising will account for more than 13% of all TV advertising, up from 9% in 2020, with heavy concentrations of demand directed to a relatively modest number of local TV markets.
China
Looking within China specifically, we see growth of 18.8% during 2021, slightly below our prior forecast in June. Still, at China’s current pace, 2021 looks much like 2017-2019, years when digital advertising exploded. Prior to the pandemic, digital media accounted for just under 80% of China’s advertising market. But this share grew substantially once Covid arrived and now accounts for nearly 90% of the entire market—one of the highest levels in the entire world. Concurrently, advertising has become much more focused around performance marketing and direct sales activities rather than brand building, which has diminished in importance over time.
Amid all this digital expansion, Bytedance has emerged as 2021’s leader in terms of absolute growth and size, and the company’s advertising revenue is now significantly greater than Alibaba’s, Tencent’s and Baidu’s. But Bytedance, which owns TikTok outside of China and is now the world’s third largest seller of advertising (after Alphabet and Meta), is not the only large-scale upstart: Pinduoduo, JD.com, Kauishou and Meituan are each now among the world’s 25 largest sellers of advertising despite their mostly single-market presence.
New rules related to digital media in China have not yet had any meaningful impact on advertising growth at an industry level.
Importantly, the scale of these companies has led to many other significant changes over the past year as the government has re-asserted its role in the economy by establishing new rules regarding the use of digital media by minors, the nature of content related to the “fan economy” and the use of algorithms and data. Anti-monopoly rules have also taken effect, with significant fines for some companies and the breaking down of walled gardens preventing the inter-operability of platforms. Although these actions can be viewed as significant—especially outside of China, where many activists believe that similar actions would be helpful in improving the relationship between society and businesses—we don’t believe there has yet been any meaningful impact on advertising growth at an industry level. Arguably, improved inter-operability between platforms could make them more appealing to consumers and to different businesses, leading to expanded growth in spending—although this could be offset by reduced incentives to invest in new consumer or ad products.
Looking toward 2022, we continue to expect growth to decelerate toward the high single digits as the pandemic-driven expansion of the industry moderates. The Beijing Olympics will likely have a modestly positive effect on the total market, although, as with Japan in 2021, the effect on the host country won’t be particularly noticeable.
United Kingdom
Meanwhile, in the U.K., we can see an even faster pace of expansion—now with a world-beating forecast among major markets of 35.7% growth for 2021, well above our September forecast of 30% growth (and despite a very modest 2.6% decline in 2020). With so much activity, digital advertising growth in the U.K. is near China levels, with narrowly defined digital advertising media capturing 78% of the industry this year, and trending toward 82% by 2026. To understand what’s driving this growth, consider that the grocery delivery space alone now features several scaled startups operating in central London, many of which have become major buyers of advertising.
Some of this activity will not be sustainable, with particular risks around spending by earlier-stage digitally-oriented companies. As a result, we think some deceleration in digital advertising is inevitable. Economic speed bumps also remain a real risk for the U.K. economy, in which staff shortages, supply chain issues (Brexit-related as well as the globally driven kind) and the risks around a resurgent pandemic are all considerations.
The United Kingdom has a world-beating forecast among major markets with 35.7% growth now expected for 2021.
But for now, the factors driving digital advertising are much the same as they are elsewhere, and only television is expected to exceed its 2019 levels in 2021. Of course, this isn’t that unusual around the world, as TV will return to 2019 levels in nine of the top 20 markets this year. However, the rate of growth of television and its contribution to 2021’s totals is somewhat significant: The U.K. has the sixth fastest pace of growth in 2021, or the fastest among the world’s top 20 markets. We note that large marketers have typically continued to retain their budget share allocations to television in 2021, despite the concurrent growth that continues for all forms of digital media.
Other traditional media will experience decent growth in 2021, but mostly because 2020 provides such a modest baseline. Looking toward the future, newspapers and magazines should generally fall by high single digits for several years to come, with growth in digital not fully offsetting print. Meanwhile, audio should essentially be above 2019 levels in 2022, and outdoor advertising should do the same by some point in 2023. Afterward, both should revert back to recent trends of mostly flat results for audio but low- to mid-single digit growth for out-of-home.
BENCHMARKING DATA:
TV STILL TYPICALLY ACCOUNTS FOR NEARLY HALF OF LARGE MARKETER BUDGETS, INCREMENTALLY DOWN OVER TIME.
A superficial read of the data included in This Year, Next Year might leave one with the impression that because 64% of the world’s advertising revenue is generated by digital media and 21% goes to TV, that marketers are allocating 64% of their budgets to digital media and 21% to TV, on average. This would be a mistaken interpretation because many advertisers—especially small ones and those whose businesses operate entirely online—often allocate all or nearly all of their budgets to digital media while large businesses typically allocate higher shares of their budgets to television.
For smaller businesses, a high digital skew could occur because digital media’s precision targeting capabilities and automated sales platforms are uniquely capable of absorbing advertising budgets that are measured in hundreds or thousands of dollars. Larger advertisers that spend 100% of their budgets online might typically be doing so because their operations are entirely transactional or direct-to-consumer. For them, too, digital media platforms offer unique advantages connecting a budget for advertising with a tangible near-term outcome and the potential for active “growth hacking” strategies, which can work well, at least up to a certain scale.
However, the world of media also includes businesses whose marketing goals are set around brand-building. They often do this by associating their products with top-tier video-based content or otherwise focusing on goals that are not most efficiently achieved through digital media. Further, for many, the combined use of different types of media can be synergistic in ways that are difficult to quantify. For example, we can reasonably assume that a strong brand should drive better performance of an e-commerce-focused advertising campaign versus the alternative of having a weak brand, although the factors that can drive a brand to accomplish this outcome can involve uncountable numbers of variables over many years or even decades.
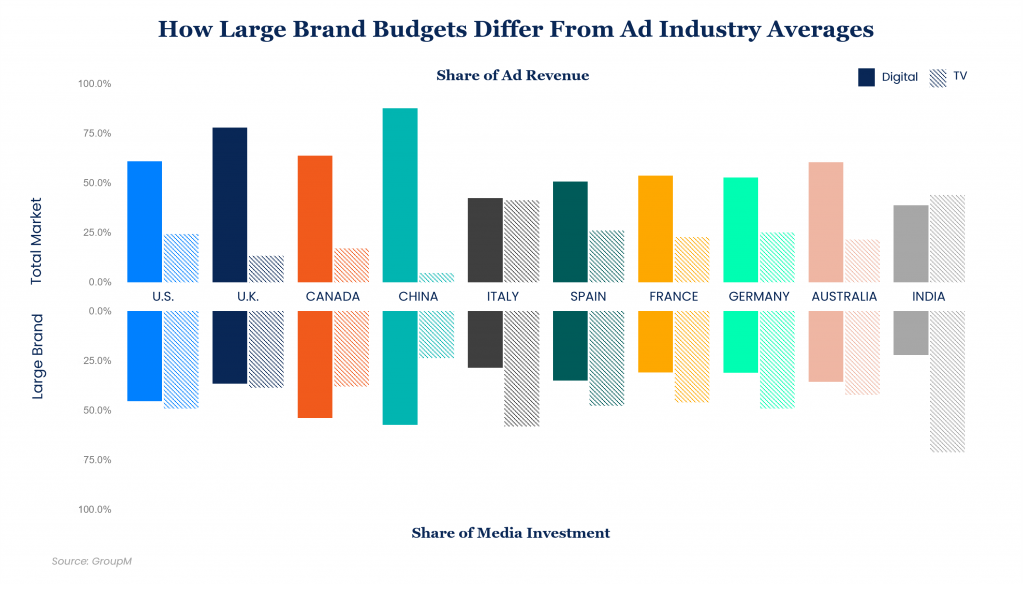
Note: Total Market percentages refer to the share of total media owner advertising revenue attributable to pure-play digital media platforms and television-based media owners, respectively, relative to all advertising industry activity in a given market based on GroupM forecasts for the full year 2021. Large Brand percentages refer to the share of actual advertising spending by GroupM clients allocated to each internet-related media less TV-related digital video (where breakouts are available) and television plus TV-related digital video (where breakouts are available) during the first nine months of 2021. In most markets data captured here only includes “like-for-like” clients with billings during each of the past three years, and in most markets only includes the largest clients (typically fewer than 100 per market) in order to reflect spending from a consistent set of large brand owners.
Given our own focus as the world’s largest agency group, servicing larger brands primarily, we wanted to better assess the typical large advertiser media mix. To do this, we looked to GroupM’s own data to find useful illustrations of the ways in which different marketers allocate their budgets around the world. In studying these trends, we primarily focused on two dominant groupings of media, television and digital platforms, and then limited our analysis where possible to a subjectively defined group of large marketers on a like-for-like basis (meaning that we included only the same marketers in each period) within each of our top 10 markets.
The most accurate benchmark for large brands to consider is that in a typical large country during 2021, a large brand is allocating 47% of its advertising budget to television, including digital video extensions, and 35% to internet-based media, excluding those digital video extensions. For reference, in 2019, television typically accounted for 48%, while digital media typically accounted for 28%. These figures reflect wide gaps between the shares of revenue that media generates, with the difference driven by the wide range of brands that spend money in a given territory.
For individual marketers, we recognize that this data may provide useful information about what other marketers are doing. However, the goal should not be to mimic them. Instead, we present this information to help spur questions about the right allocations for your brand. Well-developed media plans account for a marketer’s unique goals, apply some creativity to achieving those goals and consider what worked well for others who faced similar circumstances. It is our hope that the data presented here leads to the creation of more media plans that meet these criteria.

Global EOY Forecast
Click Here To Download Full PDFAbout the Authors

Brian Wieser & Kate Scott-Dawkins
Often been called “Madison Avenue’s de facto Chief Economist,” Brian Wieser is a highly regarded commentator on marketing, media, advertising and technology. At GroupM, he leads thought leadership around economic trends, forecasts, and insights. He is a regular contributor to GroupM articles and POV’s.
Kate Scott-Dawkins enjoys working at the intersection of advertising, technology, artificial intelligence, and creativity. She has lived and worked on three continents, and studied five languages. For the past seven years, Kate has helped Essence and its clients respond to challenges related to strategy, growth, and innovation. Her interest in future trends and competitive strategy fuel her long and ever-growing reading list.