Global Marketing Monitor: Weekly Market Trends (Aug 15, 2020)
- POV’s
- August 15, 2020
- Brian Wieser
We monitor earnings results from public companies and economic releases from countries around the world with a focus on consumer trends, advertising and digital transformation to gain a view on key trends impacting the world’s largest marketers. In this note we summarize insights observed over the past week.
This week we review new retail sales data for the U.S. and China, which showed improving trends in both countries but rapid growth in e-commerce and related activity. Our review of the world’s largest packaged goods companies reinforces this trend by identifying that the typical company among this group saw 70% growth in e-commerce activity—12% of all sales. Across all channels, companies in this sector were flat year-over-year during the second quarter. By contrast, U.S. advertising fell by more than 20% during the same period, although this figure was likely better than results posted by major European media owners. Chinese media owners that reported results fared much better, although in the shadows of geopolitical and regulatory matters.
New retail sales data was released for the U.S. and China on Friday. Retail sales offers an important lens on the health of the economy for marketers, as many of the goods most dependent on advertising are sold through these channels. For reference, in the U.S., annual retail sales amounted to $6 trillion within an economy producing $21 trillion in GDP – economic value added – during 2019 and likely somewhere around $40 trillion in total economy-wide business turnover. In China, retail sales amounted to 41 trillion RMB (or approximately $6 trillion in USD) in an economy with 99 trillion RMB of GDP last year ($14 trillion in USD).
Retail sales growth in the U.S. looks “normal” – for now. Preliminary U.S. retail sales for July 2020 showed year-over-year growth of 3.8%, similar to an upwardly revised June growth rate of 3.4% and essentially in-line with the “normal” growth of 2019’s full year levels. For reference, May figures posted a decline of 7.1% following on April and March declines of 19.4% and 6.6%, respectively. In assessing the U.S. data, it is difficult to identify the degree to which U.S. figures represent enhanced levels of spending from government stimulus activities that are now expiring or the degree to which this level of growth could be sustainable without new stimulus added to the economy.
There are, however, a wide range of diverging trends. By category, motor vehicle and dealer sales grew by 7%, decelerating only slightly from the 10% growth rate posted for June. After avoiding any month of decline during the worst of the period of lockdowns, building material and garden equipment stores continue to be very healthy; for July they rose by 16% following June’s 25% gain. Presumably the growth is aided, in part, by consumers reinvesting in their homes.
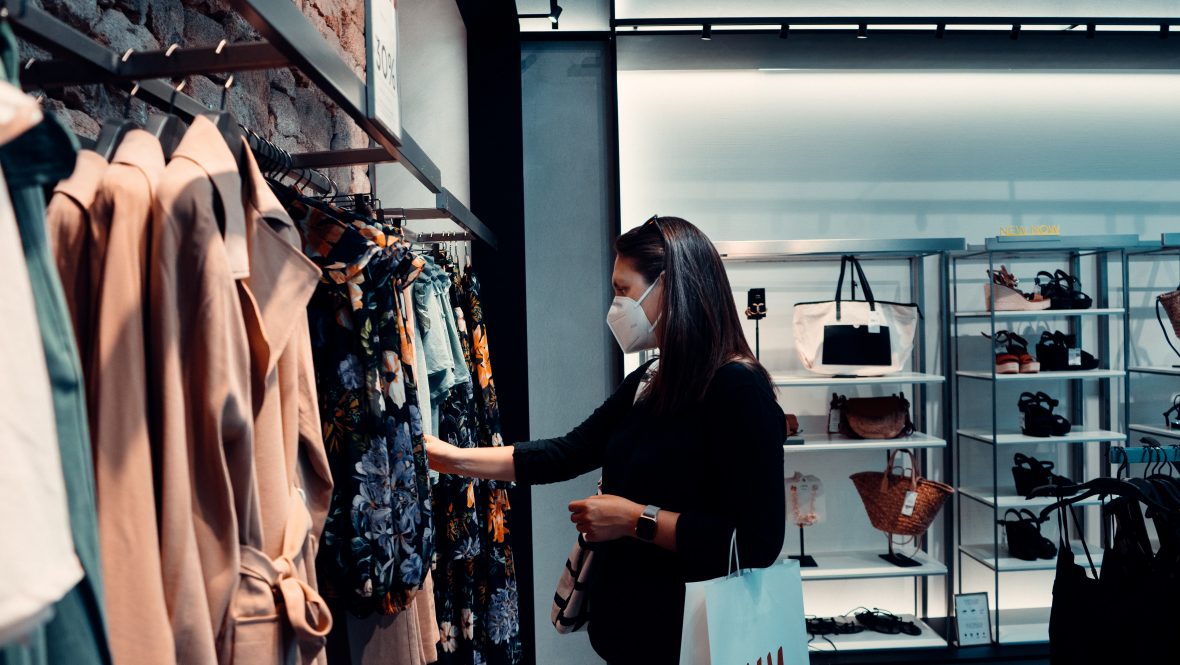
Food and beverage stores are also faring well, with a 13% rate of growth in July to follow June’s 11% growth level. By contrast, clothing and clothing accessory stores were hit particularly hard once again, falling by 20%, only slightly lower than the 26% decline in June, but still much better than the 62% rate of decline in May and 86% fall during April.
Other categories with notable declines included food service (i.e.: restaurants) and drinking establishments (i.e.: bars), which fell by 18%, an improvement from June’s upwardly revised 23% decline and much better than May’s 37% decline or April’s 53% decline. Electronics and appliances stores fell by only 2% in July following a downwardly revised 19% fall in June. Department stores fell 11% in July following on a 14% decline in June, both much better than May’s 26% decline or April’s 45% fall.
China showed improvement but was relatively weaker. U.S. trends contrast somewhat with what we see in China where the economy ended its relatively more comprehensive lockdown – when compared with the United States – at the end of February. New government data was also released on Friday and indicated that retail sales there fell by 1.1%, similar to June’s 1.8% fall.
The grand total was dragged down by an 11% decline in catering services – equivalent to restaurants and related food services activities. The catering services decline is an important point of reference for other markets as we can see how consumer behaviors continue to be affected even in markets that are only seeing limited outbreaks of the virus several months after containing it. Automotive sales were healthy, rising by 12%; however, this represented a deceleration from June’s 17% growth rate.
E-commerce is rising at a rapid pace in both the U.S. and China. During June, non-store retailers, a categorization that captures all e-commerce tracked by the Census Bureau, sustained rapid growth. This likely reflects an adaptation of consumer behaviors alongside newly available products through this channel.
June saw growth of 26% versus upwardly revised growth of 31% during June, which followed on growth of 24% in May, 22% in April and 16% in March. This category of activity represented 15% of all retail sales, or 18% excluding food services and gasoline sales.
For China, we can calculate that total online sales expanded by 19% year-over-year, only slightly slower than June’s 25% growth rate and May’s 23% pace. The scale of online retail sales remains much higher than in the U.S., as it accounted for 29% of total activity during June 2020.
E-commerce also featured prominently in the results from packaged goods companies who reported second quarter earnings over the past few weeks. Among a dozen of the world’s largest entities within this segment – Clorox, Colgate-Palmolive, Danone, Henkel, Hershey, Kimberly-Clark, L’Oréal, Mondelez, Nestle, P&G, RB and Unilever – provided new data for growth, with a median growth rate of during the quarter of approximately 70%, typically accelerating as the quarter progressed. The median share of revenue associated with e-commerce was around 12% among those providing disclosures.
Large packaged goods marketers saw stable year-over-year organic growth trends in 2Q20. More generally, across the aforementioned companies and several others whose global revenues amounted to $550 billion last year, and tens of billions in advertising spending, we have calculated that packaged goods companies’ total revenues were stable in 2Q20 versus 2Q19. This was below the 4% pace observed during 2019, but far from bad given the state of the global economy.

Source: GroupM analysis of public company reports. Composite for all periods from 1Q16 to 2Q20 includes data for business segments from Nestle, Unilever, P&G, L’Oréal, PepsiCo., Coca-Cola, Mondelez, Kraft Heinz, Danone, RB, General Mills and Colgate-Palmolive.
Notable trends included the following:
- Beverage businesses declined significantly. The most notable decline by product category was observable in non-alcoholic beverages, which we calculated as falling by 19% during the second quarter following a 1% growth rate for the first quarter and 4% growth during 2019.
- Pet food and pet care grew significantly. By contrast, pet food businesses expanded significantly from already robust levels. A composite of businesses in this sub-sector grew by 14% during the second quarter.
- Personal care was flat. Personal care products, including beauty but excluding luxury, from related divisions of companies in this sector were collectively in-line with the broader packaged goods industry averages; however, certain categories were particularly weak, like fragrances and other beauty or grooming products.
- Homecare products were up 13%. Homecare segments fared very well, with a 13% organic growth rate during the second quarter, well above 2019’s 6% pace. Laundry products were a drag, but other hygiene products grew much faster.
Regional trends were a factor in company as well, with North America up well above the global average. North America outperformed the rest of the world. Companies that provided regional breakouts saw 4% organic growth in the second quarter, well above the 2% pace of growth observed during the full 2019. The same group of companies fell by 1% during 2Q20 after a similar 4% growth rate in 2019.
By contrast, Europe significantly under-performed, as the region was much more comprehensively locked down during parts of the quarter. Commentary on China generally conveyed a return to growth there.
Underlying advertising declined around 22% in the U.S. during the second quarter. The relative strength of packaged goods companies – proportionately large advertisers versus other categories – likely helped limit the rate of decline media owners saw in the second quarter, most of whom also reported their second quarter results in recent weeks.
We can estimate that most media declined by around 22% on an ex-political basis for the quarter versus slight growth during the first quarter. If these figures match our finalized estimates, they would represent a slightly more favorable rate of decline versus preliminary estimates we made earlier in the summer.
Additional European and Chinese media owners provided new data for their businesses during the past week, reflecting substantially worse declines in Europe and better trends in China. Two significant European media owners, RTL and Ströer – among the world’s largest sellers of television and outdoor advertising, respectively – reported results for the second quarter and first half of 2020 on Thursday.
Both showed deep declines during the second quarter that were generally in-line with peers and the countries they are operating in. Both also conveyed that the third quarter is seeing diminished rates of decline. RTL ad revenues fell 40% during the second quarter. Additionally, RTL, which is the controlling shareholder of France’s M6 and owns Germany’s RTL Deutschland along with significant properties in Belgium and the Netherlands, reported advertising revenues declined 40% during the second quarter. This was similar to the results reported by its primary competitors, Germany’s Pro7Sat1, where ad revenues fell 37%, and France’s TF1, which saw a 41% decline.
Radio likely declined by more than TV during the quarter. While detailed quarterly results were not provided, the company indicated that for the half, total television advertising across the portfolio declined by 23% and radio fell by 30%. This implies a worse than 40% decline for radio in RTL’s markets.
For reference, France’s NRJ reported earnings late last month and indicated its radio ad revenue fell by 41% in the quarter and 28% for the first half. Meanwhile, at Ströer, whose business is primarily concentrated in Germany and who represents approximately half of German outdoor advertising, traditional OOH advertising declined by approximately 51%; however, the revenue reduction was 42% if we include the video related revenues that the company reports under its digital advertising segment as most, if not all, of this activity runs in OOH environments.
An improving pace of decline is expected for the third quarter at RTL and Ströer. Looking forward, RTL indicated it anticipates a pace of decline that should be around 10% for the third quarter. In its own separate earnings call two weeks ago, M6 indicated that it was “returning to normal” and experiencing “a flat situation” for July and August, which TF1 agreed it was seeing as well.
By contrast, P7S1 indicated it was seeing a 20% decline in July and a 10% decline in August. By inference, RTL’s German trends should be roughly similar to those conveyed by P7S1.
At Ströer, in the current quarter, management provided commentary around improving trends, indicating that over the last six weeks “the weekly order book development for Q3 is not that far from last year’s comparable period” with “local” (sub-regional) clients spending as normal. Local clients were described as typically accounting for 20% of revenues and book activity with mid- to long-term subscription models. Management says that 40% of clients are generally regional and 40% are national, where most of the weakness appears to be.
Ströer’s 2Q20 organic growth decline generally looks more favorable than what we are seeing from other global OOH companies. For comparison with peers, JC Decaux posted company-wide organic revenue declines of 63% in the quarter, although JC Decaux only generates slightly more than half of its revenue from Europe and has heavy exposure to airports and Asia. JC Decaux’s pace of decline, however, was very similar to those posted by Clear Channel Outdoor for Europe, where revenues fell by 62% on a constant-currency basis for the quarter. These figures imply that outdoor advertising in Germany likely fared much better than in other parts of the continent.
Meanwhile, in China we saw mixed trends from the large media owners who reported this week. Tencent advertising, only 16% of the company’s revenue base but still enough to make the company one of the world’s largest sellers of advertising, decelerated to 13% in 2Q20 versus a 32% gain in 1Q20; however, it was not far from 2019’s full year 18% growth rate.
The increase was attributed to revenue growth from Tencent’s mobile advertising network, which had increased traffic and a greater mix of video advertising with higher pricing, as well as increased revenues derived from Weixin Moments due to more inventories and impressions. The ad network accounted for a greater share of the total growth in this revenue stream than did Moments.
By contrast, “media advertising” revenues decreased by 25% because of lower advertising revenues from Tencent Video, which was impacted by weak brand advertising demand; delayed content production and releases were also cited as impacting this outcome.
Tencent trends were in some ways overshadowed by geopolitics. In the shadow of last week’s news regarding the Trump Administration’s Executive Order related to TikTok and WeChat, during its 2Q20 earnings call on Wednesday, Tencent management’s comments provided some indications on how they are approaching the situation.
They indicated they are seeking further clarification, stating “based on our initial reading…the executive order is focused on WeChat in the United States and not our other businesses in the U.S.,” noting that there is a distinction between Weixin and WeChat (Weixin is their Chinese app most similar to WeChat, with WeChat only available outside of China).
For reference, the Executive Order states that it refers to “any transaction that is related to WeChat by any person, or with respect to any property, subject to the jurisdiction of the United States, with Tencent Holdings Ltd…or any subsidiary of that entity” indicating that the company is making a point of distinction on the Executive Order’s phrase “subject to the jurisdiction of the United States.”
Consequently, the company stated that it does not anticipate any impact on advertising within China from U.S. advertisers. The company noted that the U.S. represents less than 2% of company-wide revenue, including 1% of advertising. In USD this would represent less than $1 billion in total revenue and less than $100 million in advertising revenue.
Baidu still declined, but the underlying trend improved. iQiyi remained weak and US regulatory scrutiny was announced. China’s dominant search engine, Baidu – comparably sized as a media owner to Tencent, if more mature in its growth profile – saw improving trends in its results reported this week, although advertising-related revenues were still down year-over-year, falling 8% in the quarter. This compared with a 19% decline in the first quarter.
The company’s separately traded, but 92.9% controlled, subsidiary iQiyi, which focuses on video services, also reported earnings this past week with a 4% revenue gain, but 28% decline in advertising revenue. This was similar to 1Q20’s 27% decline and also similar to the aforementioned trends for Tencent Video; however, advertising only accounted for a little more than 20% of total revenue this quarter.
Growth in other activities meant that company-wide results were actually up 4%, following on 1Q20’s 9% rate of growth. The bigger news for iQiyi, and Baidu by potential implication, related to iQiyi’s announcement that the U.S. Securities and Exchange Commission – relevant to iQiyi because its securities are traded in the United States – is investigating allegations made by a short-selling investor earlier this year related to over-statement of user numbers, among other operating and financial metrics. Investigations of this nature can serve as an overhang on a business as well as a stock while they are underway and until they are resolved.