
Global Marketing Monitor: Weekly Market Trends (Nov 14, 2020)
- POV’s
- November 14, 2020
- Brian Wieser
Key takeaways from this week’s note:
- U.K. consumer spending data shows improving, if ongoing, weakness in the third quarter.
- Global packaged goods companies posted a significant rebound from their recent trough during the same time period.
- Companies including Disney, ITV, RTL and Mediaset, all large owners of TV-focused properties, posted improving trends and expectations for relatively decent fourth quarter for advertising.
We monitor earnings results and public information related to marketers and media owners along with government data and economic releases from countries around the world. We do this to better understand consumer trends as well as advertising and digital transformation issues.
U.K. economy is important for the world to monitor. The United Kingdom’s economic trends are of particular interest globally because of the country’s absolute scale and its role as a trading partner to other nations.
While most nations are dealing with the pandemic in their own unique way, providing a range of illustrations of how social restrictions (voluntary or government-imposed) impact economic activity, the U.K. is also preparing itself for Brexit at the end of the year. This adds an additional dynamic that is likely impacting activity there.
Trends are still very negative but improving. With this context, we note new economic data for the United Kingdom released on Thursday covering the third quarter of the year.
Unfortunately, personal consumption declined dramatically once again, if by less than in the prior quarter. Spending fell by 13.0%, or 12.7% in inflation-adjusted terms, to compound upon the second quarter’s 26.0% fall. This was the most severe among major European markets during that period of time.
For reference, consumer spending in the U.K. grew by 2.2% on a similar basis during 2019 over 2018. Concurrently, household savings rates in the U.K. have been commensurately high, rising to 29% of disposable income during the second quarter versus 6.8% in the year-ago period.
Cuts were most pronounced in health and transport, down 33.7% and 31.9%, respectively, with spending on restaurants and hotels still down significantly, falling 25.1%.
By contrast, spending on food and drink rose 7.5% and spending on housing rose 1.6%. Communications services spending fell 2.2%, although this was actually an improvement relative to 2019 and 2018 trends; however, most categories of spending were still down significantly, typically by double digits.
U.K. remains much weaker than comparable trends for the United States. We can compare these third quarter figures to the recently released U.S. GDP results where we saw a 1.7% nominal decline in consumer spending. This was also an improvement, from a 9.7% decline in the second quarter.
While there are many factors that likely explain the differences between the two countries, we would speculate that one might be the availability of capital to consumers in the United States through mortgage refinancing that drove at least some of the outsized growth in the U.S.
On the other hand, though, we are mindful that uncertainty in the U.K. for a range of other reasons – including Brexit’s looming arrival alongside its related uncertainties – could be another factor driving activity down in the UK for now.
Whatever the source, to the extent there are factors depressing current period activity in the U.K. at present, a softer base this year will provide for a greater likelihood of relatively higher growth in the year to come.
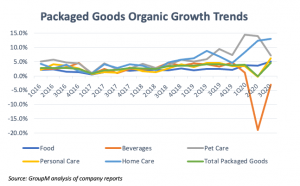
Packaged goods companies saw rapid growth in the third quarter. The relative annual improvement in the U.S., U.K. and elsewhere during the third quarter, when compared with what happened in the second quarter, was evident in the packaged goods sector.
Including food, non-alcoholic beverages, home care, personal care and pet care sectors, a core group of 18 companies, which accounted for more than $550 billion in global revenue and tens of billions in advertising spending last year, grew organically by 5.0% during the quarter, substantially above the 0.5% growth level of the second quarter and also stronger versus 2019’s 3.8% growth rate.
Although packaged goods companies are generally viewed as resilient during economic downturns, these numbers are certainly characterized as strong.
More impressively, if unsurprisingly, given the circumstances, most of these companies have seen a dramatic expansion in their e-commerce related revenues, whether from direct-to-consumer platforms, e-tail operations of traditional retailers or pure-play e-commerce companies.
Notable trends included the following:
- Beverages were still soft. The most notable decline by product category was observable in non-alcoholic beverages. This group saw a 3.1% decline during the third quarter that, while much stronger than the 19% decline in the second quarter, was well below last year’s 4.2% growth rate.
- Pet food slowed to “normal” levels. One of the stars of the early pandemic period was pet food, which grew by double digits in the first half of the year. During the third quarter, those businesses expanded 7.3%, only slightly above 2019’s 6.5% growth rate.
- Personal care was up significantly. Personal care products, including beauty but excluding luxury, divisions were collectively ahead of industry averages rising by 5.9% during the third quarter after a flat second quarter. This level was also well-above last year’s 3.7% growth rate.
- Homecare products were up 14%. Homecare segments sustained the rapid expansion they observed during the second quarter, with a 14% growth rate during the third quarter. This compared with 2019’s 5.5% pace.
- Food grew 4.9% during the third quarter. Food businesses, which account for 40% of the activity reviewed here, grew 4.9% in the quarter versus 3.8% in the second quarter and 2.3% during all of 2019.
- By region, North America grew faster than the global average. North America mirrored the global trends with acceleration versus both the prior quarter and most recent full year. For the third quarter, North America businesses grew by 5.5% versus 4.1% in the second quarter. Growth for this group of companies in 2019 was 2.0%.
- Finally, we note that e-commerce was up universally. Among the company’s making disclosures, the median company indicated 50% in revenue growth for e-commerce activity, which now typically represents 12% of revenues. This was a slower pace of expansion than the 70% growth rate observed in the second quarter, but still well above prior levels.
Large TV network owners around the world generally indicated improving trends for the fourth quarter. Media spending expectations from packaged goods companies were generally characterized in favorable terms, at least relative to what we saw earlier in the year, which was consistent with reporting by public media owners.
Several of the largest owners of television-based properties around the world also reported on Wednesday and Thursday, including Disney, ITV, RTL and Mediaset, providing additional detail to complement what we learned from companies reporting earlier in the quarter.
At Disney, traditional media network revenues saw mixed ad trends: weak at local broadcast but strong at cable. Disney’s traditional media networks business remains substantially bigger than their streaming services for now with $7.2 billion in revenue for the domestic operations, and probably another $1 billion for international networks, and fared relatively well during the quarter.
Broadcast network and station group were likely down on a like-for-like basis by high single digit levels, despite the benefits of political advertising they would have seen.
If local station group revenues were up 20% during the quarter and accounted for ~30% of segment ad revenues, underlying network advertising revenues would have been down by double digits, perhaps even 20% year-over-year. This would be roughly similar to the average decline for CBS, Fox and NBC’s networks on a combined basis.
Cable networks fared much better, probably around a high ‘teens growth rate on a 13-week to 13-week basis. Comments on the fourth quarter at least indicate expectations for growth at ESPN, if not across the broader cable network group.
Of course, the focus for Disney investors was primarily its subscription businesses.
The Hulu mVMPD service is growing rapidly and is now the fifth largest pay TV provider in the United States with 4.1 million subscribers, up from 2.9 million one year ago and 3.4 million at the end of the prior quarter.
The economics of a vMVPD are not as favorable as a traditional provider given the limited number of bundling opportunities and higher operating cost structure, but the scale of the relatively new operation is remarkable, nonetheless.
Adding in the more established SVOD service, which now has 32.5 million subscribers, the company likely generated $1.9 billion in revenue during the quarter for the unit.
Meanwhile, the now-flagship Disney+ grew its subscriber base to 73.7 million in the quarter, although the nature of its growth is less clear.
The company indicated that “little over” one quarter of the subscriber base is now HotStar, which previously operated under its own brand in India and Indonesia. At the end of the prior quarter that entity accounted for “about” 15% of subscribers indicating that 10 million subscribers of Disney+’s 16 million net “new” subscribers came from the rebranding efforts. Looking at the ex-Hotstar base, the service grew from 49 million subscribers to 55 million between the prior and most recent quarters.
While there will be some efforts to compare the Disney+ subscriber base to Netflix, which has 185 million paying subscribers and 195 million total subscribers, we note that the ARPU (average revenue per user) of the service is substantially lower at $4.52 for Disney+ versus closer to $12 for Netflix.
ITV showed improving trends for the U.K.’s TV market. The U.K.’s leading broadcaster ITV posted a 7% decline in ad revenue for the calendar third quarter, representing an improvement on the second quarter’s 43% decline. Growth is expected for the fourth quarter, which should limit the media owner’s decline in advertising to roughly 10% for the year.
Long-form viewing of the company’s channels amounted to 90 million hours in the quarter, or 2.4% of total viewing, which was down from 3.7% in the year-ago period with an absence of Love Island and fewer episodes of soaps cited as factors.
The company’s BritBox SVOD joint venture with the BBC now has 1.5 million subscribers in the United States.
Italy’s Mediaset conveyed mixed outlook for the fourth quarter for television in its home market. As indicated in its most recent earnings call in September, Mediaset performed relatively well in the third quarter as its Italian broadcast network business grew by 4.7%, more than 40% above the second quarter’s 37% decline for a similar pace of improvement as observed in other European broadcast groups.
Unlike the other companies described here, comments about the fourth quarter were relatively more negative for the final quarter of the year, as management indicated that to date ad revenues have only been slightly better than flat.
RTL showed Germany weaker than France for TV, modest growth in its streaming services. Pan-European broadcast group owner RTL reported with TV ad revenue declines of only 2.1% across the group, a much better result than the 40% decline posted in the second quarter. Radio was up 6.1% and digital advertising was down 6.1%.
While specific country revenues were not disclosed, M6’s separate reporting for the French business indicated that the remainder – mostly Germany – was approximately 1% weaker during the third quarter than the company-wide average.
Streaming services TV Now (operating in German) and Videoland (operating in the Netherlands) now have 1.79 million subscribers for €44 million in revenue during the quarter.
On a roughly stable subscriber base sequentially, though one that grew 32% year-over-year, the products generate an ARPU of approximately €8.