
Global Marketing Monitor: Weekly Market Trends (October 02, 2021)
- POV’s
- October 2, 2021
- Brian Wieser
WHAT YOU’LL READ ABOUT THIS WEEK:
We review updated data illustrating the nature of creative destruction in the global economy, the key factor supporting the rapid rates of growth the advertising industry is currently experiencing.
_____
Global advertising growth continues to look robust. The global advertising economy continues to expand at a rapid clip, likely growing at a faster pace than we previously anticipated. In the UK, for example, this past week we published revised expectations for advertising to grow by 30% vs. our prior 24% forecast, which was already remarkable considering the very modest 2.6% decline observed last year and the double-digit growth rates posted each year since 2015. While growth and decline are directionally similar to the path of the economy in the UK, there is a meaningful disconnect between the scale of change in overall economic activity and change in advertising. This has been true not only in the U.K. but in most major markets around the world.
Creative destruction remains the key driver. This rapid growth is not likely due to long-lasting marketers massively increasing their spending. Instead, as we have previously written, the broadest way to characterize the key driver of growth in the advertising economy is to reference the notion of creative destruction or the continuing replacement of old businesses with newer ones, a process that was arguably accelerated by the pandemic. It appears to remain true that a company emerging now, regardless of size, is more likely to capitalize on opportunities related to the internet as well as opportunities which are national if not global in nature, and their media budgets are likely to follow suit.
On our latest review of supporting data, we can see that these trends are likely continuing.
New business formation remains elevated. First, we continue to observe that new business formation continues at elevated levels around the world. For example, during the second quarter, growth in the US exceeded 60% and in the EU it exceeded 50%. During July and August, US data indicated a decline vs. 2020 levels, although each of those months remains massively higher than 2019 levels.
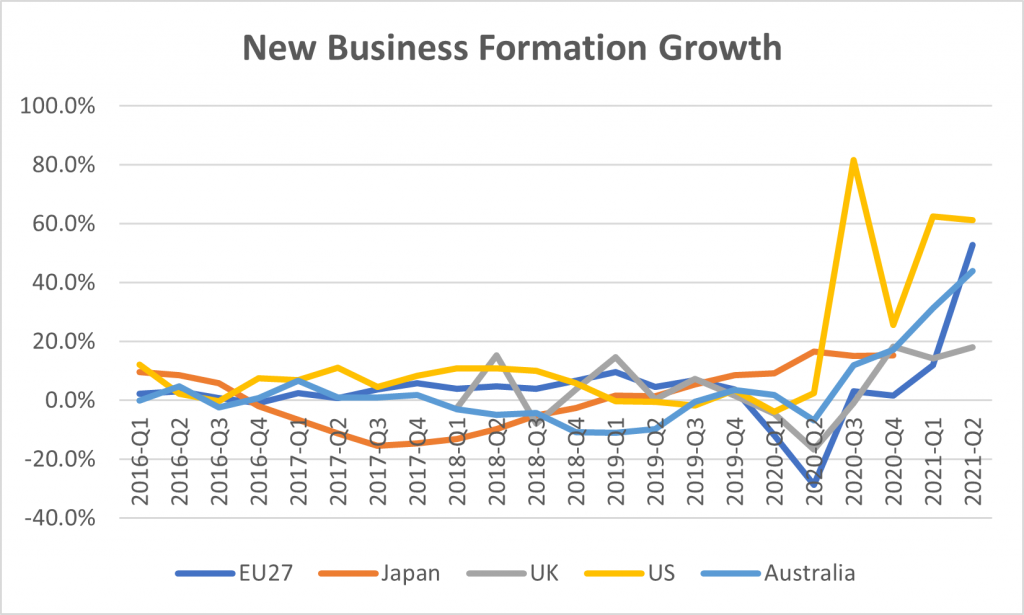
Source: For Japan, OECD Timely Indicators of Entrepreneurship; For Australia, ASIC New Company Registrations; For U.S. IRS data for Employer ID Numbers; for UK ONS Counts of Business Births; for EU Eurostat Business Registration data
Digital endemics are also continuing to grow rapidly. Larger businesses which we call “digital endemics” – companies whose businesses are rooted in the internet, whether through app-based services or traditional internet-related activities – are an important factor as well. These companies continue to grow rapidly, often chasing growth with the support of advertising, with volumes of spending that sometimes approach the company’s total revenue. In the second quarter, a group of thirty companies who meet our definition of digital endemics which are publicly listed, which have spent more than $100 million on advertising at some point in their public history, and which have published more than five years of data, grew revenues by a median rate of 31%, unsurprisingly slightly faster than the first quarter’s 29% rate of expansion, given the easy comparables of the year-ago period. However, sales and marketing – the best near-term figure tracking advertising spending for this group of companies – grew by 44%, a meaningful acceleration over the first quarter’s 27% growth rate. The figures are even more extreme if we look at the data on a weighted average basis (which is skewed by virtue of the inclusion of Google and Amazon in this group of companies), as revenue growth rose 41% in the second quarter vs. 38% in the first quarter, but advertising accelerated dramatically given last year’s cuts, rising 48% in the second quarter vs. 13% in the first quarter.
Among a separate set of newer companies that only became publicly listed more recently and are poised to meet the same criteria described above (including Bumble, Doordash, Poshmark, Squarespace, DraftKings, Skillz and Legal Zoom), growth rates in sales and marketing are even more dramatic. Revenues rose for the median among this group by 45% in the second quarter after growing 68% in the first quarter, while sales and marketing more than doubled in the second quarter – rising 103% – vs. 55% growth in the first quarter.
The massive scale of venture capital investments into internet-related sectors suggests at least some of this rapid growth can persist. This latter group of companies is likely reflective of scores of other large marketers currently operating but which remain private. We wrote last week about the delivery services sector, which has been the beneficiary of significant venture capital investments, but the trend is much broader. According to Crunchbase, during the first half of 2021, $288 billion of venture capital was invested in companies. This record level of spending was more than $100 billion higher than any other half in history (incidentally, the second half of 2020). Undoubtedly, some portion – likely a significant share – ends up flowing into the advertising industry, at least from those companies whose primary customers are consumers rather than businesses. So long as the cost of capital remains low and investors look to diversify holdings across asset classes and public market investing is increasingly commodified, pension funds, endowments, hedge funds and others who pursue long-term returns will plow significant shares of their assets into the venture. “Exit” valuations realized by these companies when capital is returned via strategic sales or public market listings are probably going to be driven by revenue growth as well, and that revenue growth will often be driven by marketing and advertising-led growth. So far as we can see, these factors should continue as a key source of growth for the advertising industry for the foreseeable future.
China remains an under-appreciated source of international advertising growth. A third important source of growth in markets around the world is China. We have previously noted that many Chinese manufacturers capitalize on low international parcel delivery costs, which have paired with the availability of self-service advertising tools on global advertising platforms and intermediaries who facilitate all of the above. Such marketers probably account for nearly $10 billion of advertising on Facebook, based on disclosures that the company makes around the regional billing addresses of its advertisers, and likely many billions more on each of Google and Amazon. Amazon itself does not disclose any data of this nature, but services such as Marketplace Pulse estimate that during September 47% of Amazon Marketplace’s top 10,000 sellers in nine major markets were based in China. While we can’t be certain regarding their advertising spending patterns, it seems highly likely that this group of merchants are responsible for a significant portion of media activity there.
It’s never a given that advertising should always grow, let alone at the levels we are seeing right now. However, when economies are dynamic, support the establishment of new enterprises and ease the manner in which older ones fade away and match up with the existence of media owners who help the newer businesses find places to support their commercial expansion, the potential for rapid growth in advertising will remain solidly in place.